Every sector, including HR, is rapidly adopting AI in 2024. As of early 2024, about 38% of HR leaders are actively piloting or have already implemented generative AI technologies within their operations, showing a significant increase from 19% in mid-2023. This is in line with another survey where 61% of CHROs planned to invest in AI in 2024.
HR metrics turn people decisions into evidence, such as candidates to hire, where attrition is coming from, whether managers are effective, and which teams are falling behind, before a review cycle confirms it.
This guide covers the metrics that matter, organised by category. Every metric includes a formula, a benchmark with a named source, and what to do with the number once you have it. It is a practical starting point, not an exhaustive list, built for HR teams that want to track the right things rather than everything.
What Are HR Metrics (and How Are They Different from KPIs)?
HR metrics are quantitative measures that track the effectiveness of people programmes, workforce health, and talent decisions. They turn observation into evidence.
Two terms get used interchangeably and mean different things. A third is often confused with both.
Metrics are measurements; employee turnover rate is a metric.
KPIs are a subset tied to a specific business goal. If your target is attrition below 15%, turnover rate becomes a KPI.
OKRs are a goal-setting framework, not a measurement system. “Reduce voluntary turnover from 24% to 15% by Q4” is an OKR. Turnover rate is the metric you use to track progress against it.
According to an HR Dive survey, 82% of executives agree HR metrics are useful for decision-making, but nearly a third want more frequent updates. Leadership already knows that people data matters. The question is whether HR has the infrastructure to provide it on a regular cadence.
Key HR Metrics
HR metrics fall into five categories, each measuring a different dimension of workforce health: Recruitment, Retention and Turnover, Engagement and Satisfaction, Performance, and Workforce and Operational.
Recruitment Metrics
Recruitment metrics measure the efficiency, cost, and quality of the hiring process. Because hiring decisions have direct budget implications, in recruiter time, job board spend, and agency fees, these are typically the first HR metrics leadership asks about.
1. Time to Fill
Time to Fill is a recruitment metric that tracks how long it takes to fill an open position, from the day it is posted to the day a candidate accepts the offer.
What it measures: The number of days from when a position is posted to when a candidate accepts the offer.
Formula: Day offer accepted − Day role posted = Time to Fill (days)
Time to fill is a capacity metric, not a performance metric. A 60-day average does not mean your recruiters are slow. It might mean your approval process takes two weeks before a role gets posted. Track it by department to find where bottlenecks live.
If engineering roles take 70 days while sales closes in 30, the problem is likely candidate supply, not recruiter effort.
2. Cost per Hire
Cost per Hire is the total amount an organization spends to fill one open position, including both internal and external recruiting costs.
What it measures: The total investment required to fill one open position.
Benchmark: $4,700 average across U.S. organizations (SHRM)
Internal costs include recruiter salaries, hiring manager interview time, and ATS software. External costs include job boards, agencies, background checks, and employer branding spend. Most companies undercount internal costs, which means their reported cost per hire is lower than reality.
3. Quality of Hire
Quality of Hire is a composite metric that measures the value a new hire delivers to the organization relative to the investment made in hiring them.
What it measures: The overall value a new hire delivers relative to the cost and effort of hiring them, combining performance, ramp speed, and retention.
Formula: (Performance Score + Ramp-Up Score + Retention at 12 Months) ÷ Number of Indicators
Benchmark: No universal standard. Track as a trend over time.
A practical shortcut: combine 12-month retention of new hires with their first performance rating. If half your new hires are gone by month eight, it does not matter that your cost per hire is below average.
4. Offer Acceptance Rate
Offer Acceptance Rate measures how often candidates say yes when your organization extends a job offer.
What it measures: The percentage of job offers extended that candidates accept.
Benchmark: 85–90% is healthy. Below 80% signals a compensation or candidate experience gap.
Track alongside time to fill. Long cycles plus low acceptance rates mean candidates are losing interest or receiving competing offers.
5. Source of Hire
Source of Hire identifies which recruiting channels, referrals, job boards, LinkedIn, and agencies are producing actual hires, not just applications.
What it measures: Which recruiting channels (referrals, job boards, LinkedIn, agencies) produce actual hires.
Formula: (Hires from Channel ÷ Total Hires) × 100
Benchmark: Varies. The goal is to identify which channels deliver quality hires, not just volume.
If employee referrals produce 30% of your hires but only 10% of applicants, that channel is outperforming everything else. Cut spending on channels that generate volume at the expense of quality.
Retention and Turnover Metrics
Retention and turnover metrics track employee retention and turnover rates and identify why employees leave. Turnover is the metric leadership asks about most. It is also the one most likely to mislead if reported as a single company-wide number.
1. Employee Turnover Rate
Employee Turnover Rate is the percentage of employees who leave an organiaation over a given period, regardless of whether they resigned, were dismissed, or retired.
What it measures: The percentage of employees who leave an organization over a given period.
Formula: (Employees Who Left ÷ Average Headcount) × 100
Benchmark: ~18% annual average across industries (BLS). Retail runs above 25%; insurance sits below 10%.
Employee turnover is the headline metric, but it hides more than it reveals. A 15% rate could mean you are losing top performers or shedding underperformers.
2. Voluntary Turnover Rate
Voluntary Turnover Rate measures the percentage of employees who choose to leave the organization (resignations only), excluding layoffs and dismissals.
What it measures: The percentage of employees who choose to leave, as opposed to those who are let go.
Formula: (Voluntary Departures ÷ Average Headcount) × 100
Benchmark: Voluntary exits typically account for 60–70% of all separations.
Voluntary turnover is the number leadership should focus on because these are the departures you could have prevented. If overall turnover is 18% and voluntary turnover is 13%, that means nearly three-quarters of attrition is people choosing to leave. Every voluntary departure has a cause. This metric is the starting point for finding it.
3. New-Hire Turnover (First-Year Attrition)
New-Hire Turnover measures how many employees leave within their first 12 months, before they have fully ramped and delivered a return on the hiring investment.
What it measures: The percentage of employees who leave within their first 12 months.
Formula: (New Hires Who Left Within 12 Months ÷ Total New Hires) × 100
Benchmark: Roughly 1 in 3 new hires leave within the first year (SHRM). Some industries exceed 50%.
First-year attrition exposes hiring and onboarding problems. If a third of your new hires leave within a year, the issue is employee retention ,not the labour market. It is usually a mismatch between what was promised during interviews and what was delivered, or an onboarding process that leaves people unsupported for too long.
This is also the most expensive form of turnover because you bear the full hiring and onboarding costs and almost none of the productivity gains.
4. Retention Rate
Retention Rate is the percentage of employees who remain with the organization over a defined period, the inverse of turnover rate.
What it measures: The percentage of employees who stay with the organization over a defined period.
Formula: (Employees Present at End Who Were Present at Start ÷ Starting Headcount) × 100
Benchmark: For high performers, target 90%+. Overall, 82–85% annual retention is solid for mid-market companies.
5. Retention Rate by Manager
Retention Rate by Manager applies the standard retention formula at the team level, showing how effectively each manager keeps their direct reports relative to the company average.
What it measures: How effectively individual managers retain their direct reports compared to the company average.
Formula: Same as retention rate, segmented by reporting manager.
Benchmark: No universal external standard. Track as an internal comparison, flag any manager running 15+ percentage points below the company average as a priority for HR review.
A 12% company-wide turnover can hide a single manager running at 45%. This metric surfaces that signal. When paired with engagement scores by team and employee retention strategies, the picture becomes clear fast.
Engagement and Satisfaction Metrics
Engagement metrics are leading indicators that measure how connected and motivated employees are before that sentiment shows up in turnover data. They tell you what turnover will look like in six months. Track only lagging indicators, and you are always reacting.
1. Employee Net Promoter Score (eNPS)
eNPS is a single-question survey metric that measures how likely employees are to recommend your organization as a place to work, on a scale of 0 to 10.
What it measures: How likely employees are to recommend your company as a place to work, on a 0–10 scale.
Benchmark: +10 to +30 is good. Above +30 is strong. Negative signals serious problems.
eNPS is the fastest engagement metric to implement: one question, under a minute to answer, trackable monthly. It is not a replacement for a full engagement survey, but it is the best pulse check available between surveys.
Organizations with strong engagement see 59% lower turnover (Gallup). If you track one engagement metric, start here.
2. Engagement Survey Score
Engagement Survey Score is a composite metric derived from a structured employee survey, aggregating responses across multiple factors: management quality, recognition, growth opportunities, and workload, into a single percentage score.
What it measures: A composite score from a structured employee survey covering factors like management quality, growth opportunities, recognition, and workload.
Formula: (Sum of Responses ÷ Maximum Possible Score) × 100
Benchmark: Engagement survey scores above 65–70% are generally considered strong. Scores below 50% warrant immediate investigation into management quality, workload, or recognition gaps.
Run these quarterly or semi-annually, not annually. Annual surveys create a 12-month blind spot. The data from a January survey is nearly irrelevant by October. Shorter, more frequent surveys (10–15 questions) produce more actionable data with less fatigue, and they let you spot trends instead of reacting to a single annual score.
3. Absenteeism Rate
Absenteeism Rate measures the percentage of scheduled working time lost to unplanned employee absences within a given period.
What it measures: The percentage of scheduled work time lost to unplanned absences.
Formula: (Unplanned Absence Days ÷ Total Scheduled Workdays) × 100
Benchmark: Below 1.5% per month is typical. Above 3% sustained often correlates with burnout or management issues.
Segment by team and manager, and a company-wide number hides localised problems. If one department runs at 4% while the rest sit below 1.5%, the issue is usually workload or management quality, not individual attendance. Track alongside eNPS for the same teams; rising absenteeism paired with falling engagement scores is a retention problem showing up before it reaches turnover data.
4. Survey Participation Rate
Survey Participation Rate measures what proportion of employees completed a distributed survey, indicating whether the results are representative of the full workforce.
What it measures: The percentage of employees who complete a distributed engagement survey.
Benchmark: Above 80% is strong. Below 60% means results may not represent your workforce.
Low participation is itself a data point. The non-respondents are often the most disengaged.
Performance Metrics
Performance metrics measure how effectively employees are meeting goals, how ratings are distributed across the organization, and whether review processes are being completed. These are the numbers that drive calibration, promotions, and succession decisions.
1. Performance Distribution (Bell Curve)
Performance Distribution shows how employee ratings spread across the organization after a review cycle, and what percentage fell into each rating tier from top to bottom.
What it measures: How performance ratings spread across the organization.
Formula: Employees in each rating tier ÷ Total rated employees = % per band
This is the metric leadership asks for most after reviews close. The question is always some version of “How did we do as a company?” If 85% of your organization is rated “exceeds expectations,” either you have assembled the most talented workforce in your industry’s history, or your managers are not differentiating.
Rating inflation is the most common problem in performance management. Calibration sessions exist to address it, but they need this distribution data to work.
2. 9-Box Score Distribution
The 9-Box is a talent mapping tool that plots each employee on a 3×3 grid combining current performance with future potential, producing a visual view of where talent is concentrated and where the succession pipeline is thin.
What it measures: How employees are distributed across a grid combining current performance and future potential.
Formula: Plot each employee on a 3×3 grid: Performance (Low/Meets/High) × Potential (Low/Moderate/High).
Benchmark: No universal distribution. The value is in the corners: high-performance + high-potential is your succession pipeline.
The 9-box is the basis of succession planning. It is also one of the most requested analytics outputs in HR platform evaluations.
3. Goal Completion Rate
Goal Completion Rate measures the percentage of assigned goals or key results that were completed or remain on track within a given review period.
What it measures: The percentage of assigned goals or key results completed or on track within a given period.
Formula: (Goals Completed or On Track ÷ Total Goals Assigned) × 100
Benchmark: 70% is healthy for stretch goals. Above 85% for committed goals.
Track at the department level. If one team hits 90% while another hovers at 40%, the issue may be goal-setting quality, not performance.
4. Review Completion Rate
Review Completion Rate tracks the percentage of performance reviews submitted on time relative to the total number assigned in a given cycle.
What it measures: The percentage of performance reviews submitted on time relative to the total number assigned.
Formula: (Reviews Submitted On Time ÷ Total Reviews Assigned) × 100
Benchmark: Target above 90%. Below 75% means your performance review data is built on incomplete information.
This is administrative but foundational. If 30% of managers have not submitted reviews, your performance distribution is based on partial data.
Workforce and Operational Metrics
Workforce and operational metrics connect people decisions to financial outcomes, linking HR activity to the Profit&Loss, productivity, and organizational design.
1. HR-to-Employee Ratio
HR-to-Employee Ratio measures the size of the HR function relative to total headcount, used to assess whether the HR team is appropriately resourced for the organization’s scale.
What it measures: The size of the HR function relative to total headcount, used to assess HR capacity and justify team resourcing.
Formula: HR Headcount ÷ Total Headcount
Benchmark: ~1:100 for mid-market. This metric helps justify HR hiring and technology investments.
2. Revenue per Employee
Revenue per Employee divides total company revenue by total headcount, producing a single figure that represents the average output contribution of each employee.
What it measures: The average revenue generated per full-time employee, a proxy for workforce productivity.
Formula: Total Revenue ÷ Total Headcount
Benchmark: Varies by industry. Use it as a trend within your own company, not a cross-industry comparison.
If revenue per employee is trending down while headcount grows, you are adding people faster than output. Present as a trend line, not a snapshot.
3. Training ROI
Training ROI measures the financial return generated by a specific training programme relative to the cost to design and deliver.
What it measures: The financial return on investment from a specific training programme, relative to its cost.
Formula: (Monetary Benefit − Training Cost) ÷ Training Cost × 100
Benchmark: Pick one measurable outcome per program (retention rate, ramp time, satisfaction score) and track for 6–12 months post-training.
4. Internal Mobility Rate
Internal Mobility Rate tracks the percentage of employees who moved into new roles within the organization through promotions or lateral transfers over a given period.
What it measures: The percentage of employees who move into new roles within the organization through promotions or lateral transfers.
Formula: (Internal Moves ÷ Total Headcount) × 100
Benchmark: No universal standard. Companies with higher internal mobility rates consistently report lower voluntary turnover; track yours as a year-over-year trend.
If your internal mobility rate is near zero, employees need to quit to get a promotion. Companies with active internal mobility programs tend to see lower voluntary turnover because people find new challenges without leaving.
5. Span of Control
Span of Control measures the average number of direct reports each manager oversees across the organization, used to assess management layers and coaching capacity.
What it measures: The average number of direct reports per manager across the organization, used to assess whether managers are stretched too thin or whether there are too many management layers.
Formula: Total Non-Manager Employees ÷ Total Managers
Benchmark: 3–8 direct reports is typical. Below 3 suggests too many management layers. Above 10 means managers may be too stretched for meaningful coaching.
This metric informs org design decisions. Knowing your average span of control helps you make intentional structural choices rather than drifting into an accidental org chart.
Which HR Metrics Should You Start With?
Most guides list 25 metrics and leave you to figure out where to begin. Here is a framework based on the company stage.
Tier 1 (0–50 employees, first HR hire): Start with three metrics: Turnover Rate, eNPS, and Time to Fill. These give you a pulse on retention, engagement, and hiring speed. You can maintain all three with a spreadsheet, a monthly one-question survey, and a simple log of when roles open and close.
This takes under two hours a month and gives you something concrete when leadership asks how the people’s side is going.
Tier 2 (50–200 employees, small HR team): Add Voluntary Turnover, Engagement Survey Score, Review Completion Rate, and Cost per Hire. At this stage, you are running formal review cycles. Track whether people complete them. You are hiring multiple roles per quarter. Track what it costs.
You have enough headcount for the voluntary versus overall turnover distinction to be meaningful. And a quarterly engagement survey, even just 10 questions, gives you trend data that a single eNPS score cannot.
Tier 3 (200–500 employees, structured HR function): Add Performance Distribution, 9-Box, Goal Completion by Department, Retention by Manager, and Internal Mobility. You are making calibration and succession decisions. You need performance data that goes beyond averages.
You need to know which managers are losing people and whether goals are being hit at the team level, not just individually. This is where metrics shift from “reporting what happened” to “predicting what happens next.”
Tier 4 (500+ employees, HR business partner model): Add Revenue per Employee, HR-to-Employee Ratio, Training ROI, Span of Control, Diversity Metrics, and Predictive Turnover Risk.
At this scale, you are building a people analytics function. Revenue per employee and training ROI speak the CFO’s language. Predictive turnover models let you intervene before high performers leave, not after.
The pattern from most mid-market companies: Organizations with 50 to 300 employees typically operate at Tier 1 or 2, even when their headcount suggests Tier 3. The reason is usually not ambition. It is that everything runs manually, and there is no infrastructure to sustain more metrics without consuming the entire week.
If this is you, do not feel behind. You are the majority. Start where you are, get those metrics clean, and add the next tier when you are ready.
Track these metrics without building a spreadsheet for each one
Peoplebox.ai’s people analytics dashboard surfaces the performance and engagement metrics from this guide, 9-box grids, performance distribution, goal completion rates, review completion rates, and engagement trends, automatically.
Knowing which metrics to track is half the job. The other half is presenting them, so leadership acts, not just nods.
What the CFO Wants
CFOs think in three categories: cost, risk, and return. Every metric you present should map to one of them.
For cost: show cost per hire trends and turnover replacement costs, estimated at 30–200% of salary, depending on seniority. For risk: flag rising voluntary turnover, engagement dips, and open roles ageing past 60 days. For return: demonstrate training ROI, revenue per employee trending up, or retention rate improving after a specific initiative.
If a metric doesn’t fit one of these three, a CFO will listen politely and forget it by the next agenda item.
What the CEO Wants
CEOs want to know three things: whether the right people are staying, whether the culture is healthy, and whether managers are driving performance or undermining it.
Two visuals answer all three. A 9-box grid shows talent distribution across performance and potential, giving the CEO a clear view of who’s ready to step up and where the pipeline is thin. Retention rate by manager shows which leaders keep their people and which don’t, making manager effectiveness visible without requiring a single qualitative judgement.
Together, they answer the question every CEO has after reviews close: are we growing the right people, and are our managers part of the solution?
Recommended Reporting Cadence
Not all metrics move at the same speed. Reporting them on the wrong cadence either floods leadership with noise or leaves them making decisions on stale data.
Monthly: eNPS and goal completion rate. These shift quickly enough that a quarterly view misses the signal. A drop in eNPS in February that goes unreported until April is already a retention problem by the time leadership sees it.
Quarterly: turnover analysis and performance distribution, ideally pulled after review cycles close. These take a full quarter to become meaningful; monthly reporting on turnover creates panic over normal variation.
Annually: a full metrics review with year-over-year comparisons across everything you track. This is the slide deck that answers “Are we better at people than we were twelve months ago?”
How to Format Metrics for Leadership
A single data point tells leadership where you are. A trend line tells them where you’re going and whether what they invested in made a difference. Rather than presenting eNPS as a number (“we’re at +22”), show the movement, eNPS rising from +8 to +22 over six months, correlated with the launch of a manager coaching programme. That’s a story leadership can act on. A number without context gets noted. A trend with a cause gets funded.
Wherever possible, pair engagement data with retention data on the same slide. When a CFO sees engagement rising and voluntary turnover falling in the same quarter, following a specific initiative, HR stops being reported as a cost centre and starts being treated as a strategy function.
The 5 Biggest Mistakes HR Teams Make With Metrics
1. Tracking too many at once: A dashboard with 30 metrics is a spreadsheet with better formatting. If leadership cannot look at your report and immediately spot the two or three numbers that need attention, you have too many. Start with 3 to 5. Add more when those are clean.
2. Measuring only lagging indicators: Turnover rate tells you what has already happened. eNPS and engagement trends tell you what is about to happen. If you only report lagging indicators, you are always explaining problems after the damage is done. Pair every lagging metric with a leading one.
3. Not segmenting by manager or department: Company-wide averages are useful for board slides. They are nearly useless for operational decisions. A 12% turnover rate can hide one team at 30% and another at 5%. Always break down retention, engagement, and performance data by team.
4. Collecting data without acting on it: If your engagement score drops 8 points quarter-over-quarter and nothing changes, the survey process loses credibility. Employees notice when feedback disappears into a void. Every metric should map to an owner and a response plan. If you cannot commit to acting on a metric, do not track it.
5. Tracking efficiency without impact: CFOs care about return on investment, not just speed. Tracking only efficiency metrics, time to fill, and cost per hire, tells leadership how fast and cheap your hiring process is. It says nothing about whether the people you hired were right.
Pair every efficiency metric with an impact metric. Time to fill is paired with quality of hire. Cost per hire paired with retention at 12 months. If you report faster hiring without showing that quality is maintained, the story is incomplete, and a CFO who asks the follow-up question will notice.
Where to Start
Most HR teams do not fail because they track the wrong metrics. They fail because they try to track everything at once with no system to support it, and the whole effort collapses into a spreadsheet by Q2.
Start with the tier that matches your stage. Get those metrics clean. Present them in a way that makes your CFO and CEO pay attention. Then expand.
The metrics in this guide are not aspirational. They are what high-performing HR teams already track. The only question is whether you track them deliberately or continue drifting.
FAQs
What are the most important HR metrics to track?
The five most important HR metrics to track are Employee Turnover Rate, eNPS, Cost per Hire, Review Completion Rate, and Time to Fill. Together, they cover the core people functions: retention, engagement, cost, hiring speed, and review compliance. These five give any HR team a defensible starting point regardless of company size or infrastructure.
How do you calculate employee turnover rate?
Employee turnover rate is calculated by dividing the number of employees who left during a period by the average headcount, then multiplying by 100. Example: 18 departures with an average headcount of 200 = (18 ÷ 200) × 100 = 9%. Run this calculation monthly or quarterly, and always segment by department; a company-wide number hides where the real attrition is happening.
What is a good eNPS score?
A good eNPS score is between +10 and +30. Above +30 is strong. A negative score signals serious problems that warrant immediate investigation. The most useful approach is not judging a single score in isolation but tracking eNPS as a monthly trend; a score rising from +8 to +22 over six months tells a more actionable story than any single data point.
What is the difference between HR metrics and HR KPIs?
HR metrics are any quantitative measurement of a people process; for example, metrics such as absenteeism rate, time to fill, and turnover rate are all metrics. HR KPIs are a subset of metrics tied to a specific business goal. Turnover rate is always a metric. It becomes a KPI when you attach a target to it, such as “reduce voluntary turnover below 12% by Q4.” All KPIs are metrics, but not all metrics are KPIs.
How often should HR metrics be reported?
HR metrics should be reported on a cadence that matches how quickly each metric moves. Monthly for fast signals, eNPS and goal completion rate shift quickly enough that a quarterly view misses the signal. Quarterly for performance distribution and turnover analysis, ideally after review cycles close. Annually, for a comprehensive year-over-year review across all metrics tracked. Consistency matters more than frequency; a predictable reporting rhythm builds more leadership trust than irregular updates.
What HR metrics should I report to the board?
Board-level reporting should focus on three areas: financial impact, organizational health, and people strategy progress. For financial impact: cost per hire, turnover replacement cost, and revenue per employee. For organizational health: voluntary turnover rate and eNPS trend. For people strategy progress: goal completion rate and internal mobility rate. Present all of these as trend lines, not point-in-time numbers; a chart showing eNPS rising over six months tells a story the board can act on. Keep it to three metrics per meeting maximum; more than that turns a strategic discussion into a data review.
What stood out is the deep understanding of the Peoplebox.ai team and their willingness to listen & enhance the platform to scale with our long-term needs.
Khilan Haria
VP and Head of Payments Product, Razorpay
I'm glad that we partnered with Peoplebox.ai for our company-wide OKR rollout. Thanks to its simplicity, we achieved significant adoption within two quarters
Rohit Arumugam
Business Head, Nova Benefits
Since we started using Peoplebox.ai, we have been able to bring all of our leadership across the organization together and show them how all of our goals align
Jaclyn Hoover
Senior Director HR, Propel School
Driving the entire interface through slack is simply brilliant especially for a tech product company! There was zero time spent on training! It can not get easier than that!
Swapna Nair
VP - HR, Khatabook
I chose Peoplebox.ai because it had integrations with the tools we use for sales and engineering to automate updating of key results and sync projects
How to Roll Out OKRs for First Time: 7 Steps Startegy
How to Roll out OKRs for the first time is a question common among organizations just introducing OKRs.
Imagine a scenario-
You are rolling out OKR for the first time.
One thing goes wrong and… Boom!
Your employees are already hating the process- even before it took a pace.
You certainly wouldn’t want that to happen in your organization. OKRs can surcharge and accelerate your organizational growth. But the key is to get this done right.
That’s why a well-planned rollout is significant for the success of an OKR system.
Introduce the new goal-setting approach strategically but not in a mechanical process. Every organization is unique and can face unique challenges while implementing OKRs.
[elementor-template id=”89725″]
How to roll out OKRs: Here are 7 Best Practices for a successful OKR rollout
1 Communicate the OKR Methodology to all the teams
Get everyone in the organization on board with OKRs. Present the concept clearly and precisely. Educate everyone on the OKR language.
While some people will embrace the changes with open arms, there are also going to be some skeptics into the bargain. You must let them express their concerns and provide answers to their “why, how, and what?” questions.
Explain to them the benefits of implementing the OKR framework. Highlight how it’s going to impact the business and the individual success of the employees.
Organize workshops, training, discussions, introductory presentations, and seminars to help your employees’ design quality OKRs. Transparently explain to them the strategic execution, alignment, expectations, and tools they will be required to use for the purpose.
To help everyone speak the same language, document your company OKR framework
2 Inspire with success stories
List the names of reputed companies like Google, Netflix, Intel, LinkedIn, Twitter, etc. which have successfully implemented OKRs. Narrate their success stories to help them visualize how OKRs can cater to their individual success.
For example, OKRs helped LinkedIn become a 20 Billion Company. Jeff Weiner, CEO of LinkedIn, describes OKRs as, “something you want to accomplish over a specific period of time that leans toward a stretch goal rather than a stated plan.
It’s something where you want to create greater urgency, greater mindshare.”
You can either go for an organization-wide rollout Consider running an OKR Pilot first, depending on what fits you best.
If you have a culture that’s open to change and a flexible structure of functioning, an organization-wide rollout will work best for you. But it’s always best to take small steps. Start from one part and gradually move to others.
[elementor-template id=”89725″]
Crafting and implementing OKRs across the entire organization can seem overwhelming especially if you are a large organization. Instead, choose a particular part of the organization and run a pilot project.
“If you concentrate on small, manageable steps you can cross unimaginable distances.”
It’s also important to decide “how often?” will OKRs be reviewed. Will it be done quarterly or annually?
4 Go for the Top-down approach
A top-down approach to OKRs was the first pattern attempted. The top management has a significant role in setting the overall direction of the company. Starting from the top provides clarity for the rest of the organization.
“People buy into the leader before they buy into the vision.”
For example, you can start with the senior leadership team. Make them an example to roll out OKRs to the departmental heads. From there you can move on to team leaders, and to the rest of your teams.
5 Get aligned
You can’t just sit with a blank sheet in front and magically start crafting the perfect OKRs. You need to understand the context. Make the company mission and vision your starting point and tailor your OKRs accordingly.
Buy-ins are critical for OKR success. The success of OKRs depends on the collective effort of each team member. You can imagine it as a group dance performance where everyone needs to perform their parts well to make it a masterpiece.
Thus you need to align the efforts of the workforce, executive leaders, and company heads both horizontally and vertically. This will help you foster transparency, smooth cross-functional communication, and reduce overlap among departments.
6 Track and monitor progress
Tracking OKRs are important to evaluate and measure the progress and understand which teams are falling short.
You can identify any issues and make course corrections as required by Monitoring progress.
Leverage technology to track OKRs. It will make the process transparent.
Using OKR software will also automate the calculations and save your time as you are no longer required to manually update the progress of each team member.
Bonus tip: Remember to celebrate whenever you Hit the nail on the head through OKR win meetings and shoutouts to keep
7 Do frequent check-ins
To stay on top of OKR progress, you need to do regular check-ins. Employees might feel overwhelmed with concerns and doubts, especially in the initial days.
Regular check-ins will give your employees direction. And provide them the required assistance and guidance. Frequent Check-in meetings will also identify the overlappings, increase accountability and ensure execution.
Define your preferred frequency of Check-in meetings. You can do it weekly or monthly as per your organization’s needs. Although weekly check-ins are most recommended to keep track of the progress and evaluate continuously.
Have OKR Champions
Consider having OKR champion who starts implementing the OKR framework with a strong war cry. Build a team of champions who will work as ambassadors to head the change. And make the OKR framework run smoothing across the organization.
They work as mentors and internal OKR experts. And can help you adopt and execute OKRs at all levels of the organization. These OKR enthusiasts will make sure that every concern is addressed, every ‘whys and wherefores’ are explained.
Too many objectives and key results: Less is more. Don’t set more than 5-7 Objectives and 3-5 key results.
Fill it, Forget it: Don’t set OKRs just to forget in a few days.
Mixing KPIs with OKRs: KPIs aren’t a substitution for OKRs. They have separate roles and outcomes.
Rigidity: Rigid adherence to rules can lead to disengagement. Instead, move forward with a flexible and intuitive OKR approach
Link OKRs with Recognition: Don’t make the mistake of making OKRs a base for your reward and recognition program. It can negatively affect performance. And compromises the business output.
The start is never perfect
You might struggle when you are just starting. But after a few OKR cycles, you are sure to hit your stride.
To end, OKR’s success depends on consistency. So, remember to continuously reflect, learn, and refine the process.
Hope we were able to answer all your queries in our blog How to roll out OKRs for the first time? If you have questions feel free to comment below.
Pooja Pooja
Types of OKRs: Aspirational OKRs vs Committed OKRs
Every organization wants to grow, but how do you set goals that are both achievable and visionary? The answer lies in the types of OKRs: committed and aspirational.
Whether it’s near-term performance or long-term innovation for your business, you’ll know just how to leverage the power of committed and aspirational OKRs effectively to unlock new levels of success for your business.
Committed OKRs are about clear, attainable targets that teams can confidently deliver within a set timeframe. This type of OKR delivers accountability and is important for day-to-day business success.
Aspirational OKRs, on the other hand; push teams to be bigger and challenge themselves. The moonshots: ambitious OKRs are meant to stretch an organization from its comfort zone, kindling innovation and long-term growth.
In the rest of this blog, we will take the difference between these two types of OKR apart and see how to balance them in such a way that they enable performance as well as inspiration.
What are Aspirational OKRs and Other Types of OKRs?
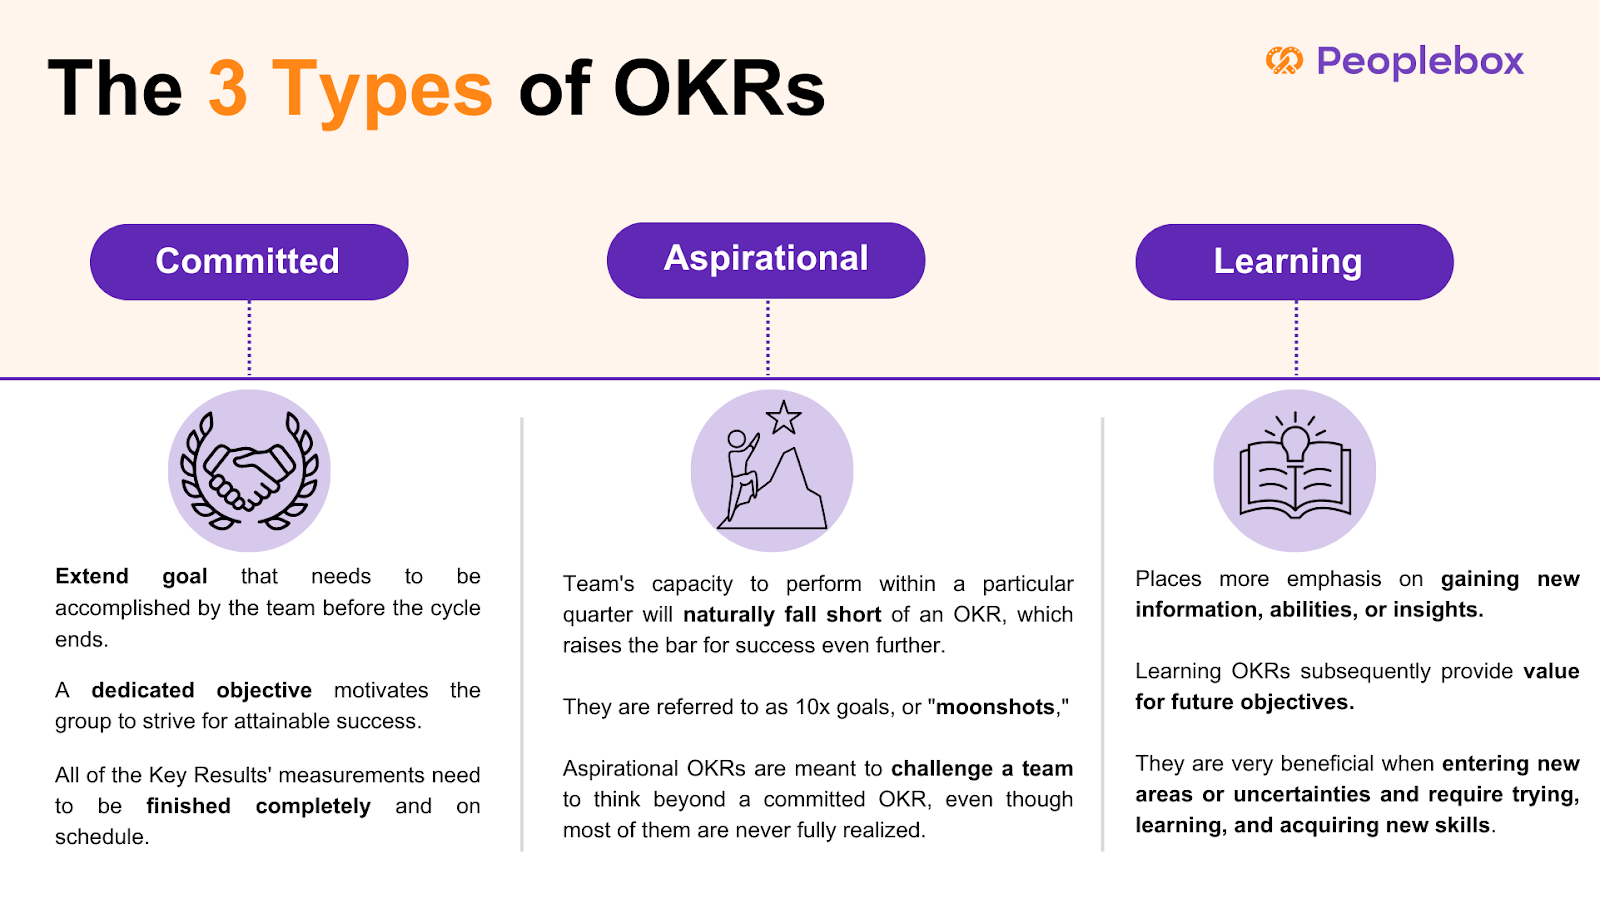
A committed OKR is a stretch goal that the team has to achieve or complete before the cycle is over. A committed goal pushes the team to reach, but still achievable attainment. All metrics of the Key Results must be completed fully and on time. Consider a situation like this:
Daniel’s organization and his teams have agreed to execute certain OKRs and have mapped a precise action plan on how they are going to do so.
These are called Committed OKRs.
An aspirational OKR sets the bar for success further out, and by design will exceed a team’s ability to execute in a given quarter. When they set such a high bar as to be seemingly impossible they are called 10x goals, or “moonshots.” While most aspirational OKRs are never fully achieved, they exist to push a team to think bigger than a committed OKR. Consider the following case:
Martha’s organization is more visionary. They have stretched goals. And her teams are not likely to fully achieve these ambitious goals.
These are called Aspirational OKRs.
Understanding the distinction between aspirational and committed goals is crucial for effective goal-setting and team motivation within the OKR framework. Aspirational goals encourage ambitious thinking and long-term vision, while committed goals focus on immediate, measurable outcomes.
Learning OKR focuses on the acquisition of knowledge, new skills, or insights rather than a direct achievement of business outputs. Extremely helpful when entering new areas or uncertainties and requires experimenting, learning, and developing new skills, Learning OKRs distinguish between usual output measuring of success and measuring acquisition of knowledge, that will later add value for future objectives. For example:
Jerry wants to gain a deep understanding of machine learning to drive full product development. He wants to finish three advanced courses and test his skills by building a model in sandbox.
These are called Learning OKRs.
Aspirational OKRs and Committed OKRs: Key differences
When you aim for the stars, you may come up short, but still reach the moon.
– Larry Page
Read on to find out the key difference between Committed OKRs and Aspirational OKRs.
Objective
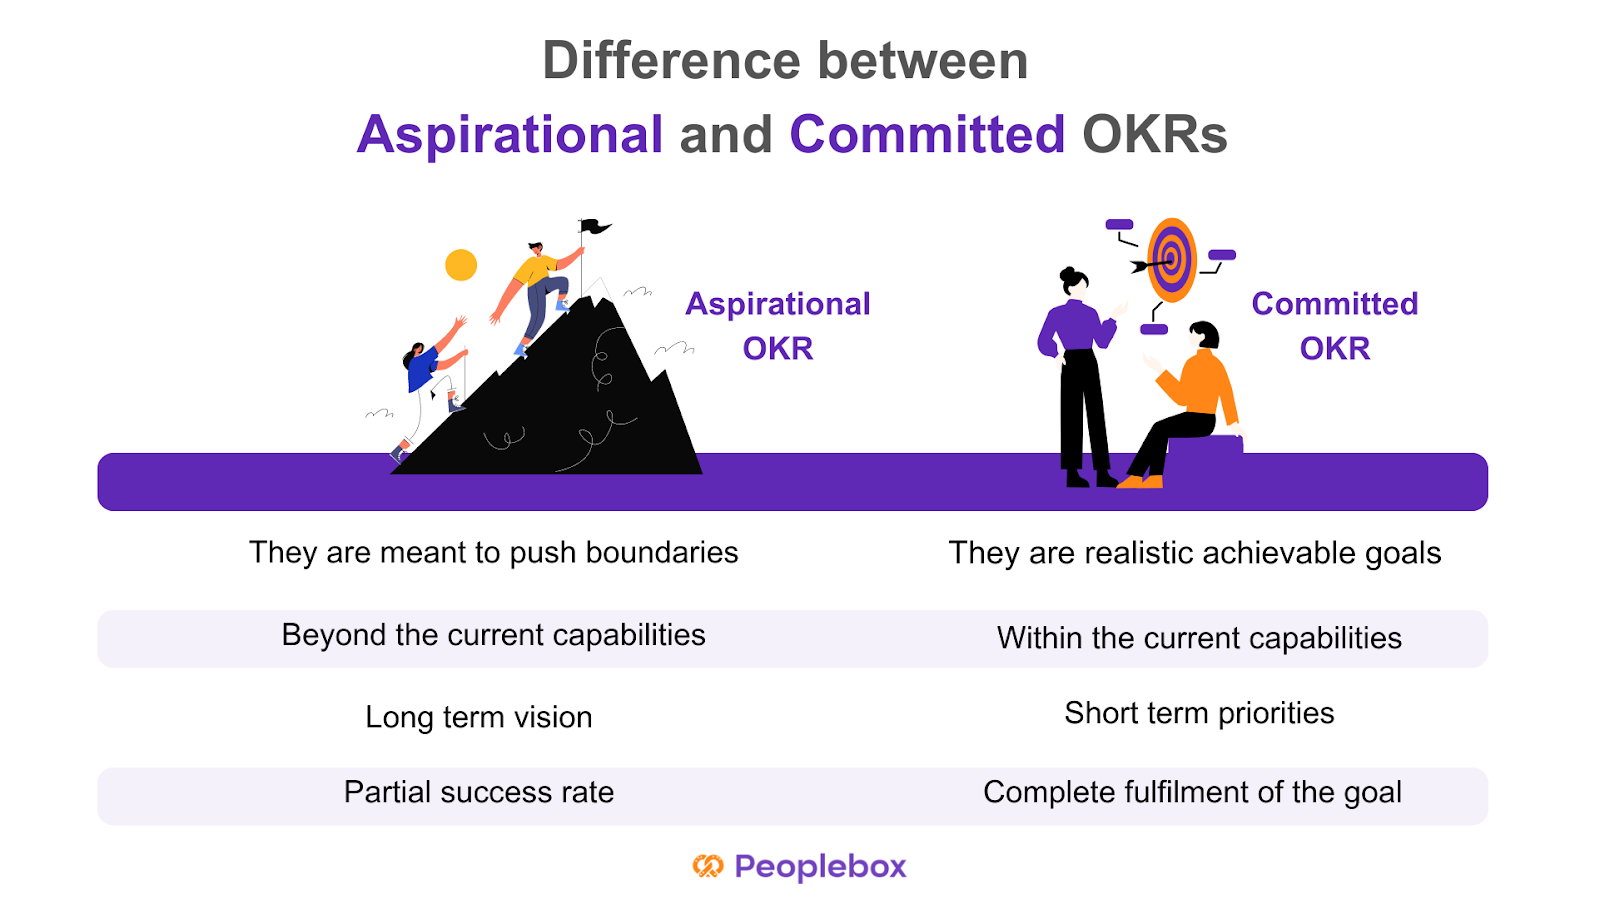
Aspirational OKRs are meant to push the boundaries and encourage employees to achieve visionary objectives. Committed OKRs, on the other hand, focus on committed objectives that offer a more realistic vision of goals with fully achievable results.
Aim
Committed OKRs help companies achieve their goals through individual and team achievements. Aspirational OKRs are often beyond the current capacities of the organization but help in pushing boundaries.
Timeframe
Aspirational OKRs are usually created to focus on long-term strategic vision while Committed OKRs offer short-term operational priorities to guarantee progress in the short term.
Committed OKRs are supposed to have a 100% success rate as each key result comprises fully achievable targets. Aspirational OKRs are usually found to have a success rate of 60-70%.
Committed and Aspirational OKR examples
The difference between committed and aspirational OKRs is subtle. Committed objectives are meant to be fully achievable, requiring teams to concentrate on straightforward priorities without taking unnecessary risks, ultimately serving as motivational tools to foster small wins and consistent progress.
A standard example in the sales team scenario might be like:
Committed OKR
O: Expand to the US market
KR1: Close first 6 start-ups
KR2: Get a meeting-to-close rate of 6%
KR3: Reach average deal size of $200
Aspirational OKR
O: Capture the entire US market in one quarter
KR1: Get onboard 95% of big customers in the US market to grow over competitors
KR2: Get a meeting-to-close rate of 30%
KR3: Reach average deal size of $2000
In the managerial team, these OKRs can manifest like such:
Committed OKR
O: Improve customer satisfaction with the existing solutions
KR1: Increase customer satisfaction score (CSAT) from 85% to 90% by the end of the quarter.
KR2: Reduce average response time from 15 minutes to 10 minutes within the next three months.
KR3: Train 100% of the support team on the new customer service tools within six weeks.
Aspirational OKR
O: Become the market leader in AI-powered customer service solutions.
KR1: Achieve a 30% market share in the AI customer service industry by the end of next year.
KR2: Launch three groundbreaking AI features that no competitor currently offers within 18 months.
KR3: Secure a partnership with at least two top-tier companies by the end of next year.
In a tech context, OKRs like these can come up:
Committed OKR
O: Improve the performance of the app and reliability
KR1: Reduce app crash rate from 2.5% to under 1% within the next quarter.
KR2: Decrease page load times by 30% in six months.
KR3: Fix 100% of the top ten reported bugs within the next two sprints.
Aspirational OKR
O: Revolutionize the user experience of our mobile app.
KR1: Increase daily active users (DAU) by 100% within 12 months.
KR2: Develop and launch a fully AI-driven recommendation system that personalizes the user experience by the end of the year.
KR3: Achieve a 4.8+ rating across app stores by introducing five innovative features within the next 18 months.
How to decide between Committed OKRs and Aspirational OKRs?
Committed OKRs will work best if your organization is newly introduced to the framework or is still in the rolling-out phase.
With each goal achieved, your team’s motivation and engagement will rise higher. In addition, teams easily get into the habit of running Committed OKRs and make it part of their work culture.
But if you have already used the framework in the past, aspirational OKRs can do wonders for you.
Creating a result-driven work culture takes time. It demands discipline, continuous effort, and a mindset shift of employees and management. So you should start simple and focus on learning the methodology first. And set up the necessary processes to make it work.
Setting aspirational OKRs in the very beginning would make your teams feel overwhelmed and over-pressurized. Extremely ambitious Key Results soon become too much to handle. Learning a new methodology takes time. Once your teams are used to the framework and it becomes a part of their work-life, you can consider aspirational OKRs.
With the later process, you can have objectives and a combination of committed and aspirational key results. While some key results will be easier to achieve, others will aim higher. Understanding the distinction between aspirational and committed goals is crucial for better goal-setting and team motivation.
Choosing the Right Type of OKRs
Choosing the right type of OKRs depends on the organization’s goals, culture, and priorities. Committed OKRs are suitable for organizations that need to achieve specific, measurable outcomes within a set timeframe. They are ideal for teams that require a clear direction and a sense of accountability. Aspirational OKRs, on the other hand, are suitable for organizations that want to drive innovation, creativity, and excellence. They are ideal for teams that want to push the boundaries and strive for something bigger.
When choosing between Committed and Aspirational OKRs, consider the following factors:
What are the organization’s goals and priorities?
What type of culture do we want to foster?
What kind of outcomes do we want to achieve?
What level of risk are we willing to take?
By considering these factors, organizations can choose the right type of OKRs that align with their goals, culture, and priorities. Whether you opt for committed or aspirational OKRs, the key is to ensure that they are aligned with your company aims and internal communication processes, fostering a balanced approach to achieving both immediate and long-term objectives.
How to balance Committed and Aspirational OKRs?
There is no one-size-fits-all answer, but where OKRs are aligned with company strategy, teams are well educated, open communication exists, and performance is reviewed regularly, it will help keep the balance between aspirational and committed OKRs intact.
However, the first step in finding equilibrium between the two forms of OKRs is that there has to be a knowledge of the difference. It needs to be apparent from the outset that everyone involved makes it clear the distinction between the two OKRs.
Teams and employees may have suitable insights that will assist in determining what is realistically achievable (committed) and what is a stretch but possible (aspirational). This can help determine what the balance ratio for the OKRs is going to be.
A very critical element to succeed with OKRs is reviewing and tracking the progress. With weekly check-ins, teams can go through their OKRs regularly and update the same performance data. It becomes easy to track how they have progressed on the outcome of the OKR in the OKR review process.
The grading of OKRs is very clear on the distinction between committed and aspirational goals. Committed OKRs are things to be accomplished within the cycle, and grading is binary: pass or fail. That is, an OKR is said to be successful if 100% of it is accomplished; otherwise, it is regarded as a failure. Aspirational OKRs, on the other hand, are graded along a more nuanced scale.
Common mistakes to avoid while setting up Aspirational OKRs
Here are 6 common mistakes organizations commit while setting up aspirational OKRs-
1️⃣Ignoring organizational structure and needs
A common mistake most organizations commit while writing aspirational OKRs is to write something like, “What can be done more if we have extra resources and luck favors us ?” Instead, you can pretend to be a genie and strive to understand “What our customer needs at present moment?”
2️⃣Unrealistic aspirational OKRs
Aspirational OKRs don’t imply setting unrealistic goals. It should be achievable, with the understanding that your teams won’t have any clue about how to achieve these OKRs. Aspirational OKRs demand overuse of resources. They are fluid and flexible. But still helps your teams focus on well-defined goals.
3️⃣Writing a low-value objective (LVO)
Moving forward with a “Who cares?” attitude is a common pitfall among organizations. Low-value objectives go unnoticed even after the successful completion of the key results.
4️⃣OKRs should be framed to gain tangible benefit
OKRs are a tool for organizations to work for big goals in the long run by breaking them into small chunks that can be achieved within a shorter cycle.
5️⃣A committed OKR must deliver a 1.0
It makes the framework stiff and doesn’t leave scope for improvement.
6️⃣Too many OKRs
How many aspirational OKRs you should set for one cycle will depend on your company’s resources. But never aim for too many Objectives and key results. As it can easily divert your focus altogether.
Best Practices for Implementing OKRs
Implementing OKRs requires a structured approach to ensure success. Here are some best practices to consider:
Align OKRs with company goals: Ensure that OKRs align with the organization’s overall goals and priorities.
Make OKRs specific and measurable: Ensure that OKRs are specific, measurable, achievable, relevant, and time-bound (SMART).
Set ambitious yet achievable goals: Set goals that are challenging yet achievable, and provide a clear direction for the team.
Establish clear key results: Establish clear key results that indicate progress towards achieving the objective.
Track progress regularly: Track progress regularly and provide feedback to teams and individuals.
Foster a culture of transparency and accountability: Foster a culture of transparency and accountability, where teams and individuals are held accountable for their progress.
Provide training and support: Provide training and support to teams and individuals to ensure they understand the OKR framework and how to use it effectively.
Review and adjust OKRs regularly: Review and adjust OKRs regularly to ensure they remain relevant and aligned with the organization’s goals.
By following these best practices, organizations can implement OKRs effectively and achieve their goals. Regularly reviewing and adjusting OKRs ensures that they stay aligned with the evolving needs of the organization, helping teams to maintain focus and drive continuous improvement.
Conclusion
Now that you know the difference between committed and aspirational OKRs and how they can impact your organization’s success, it’s the decision time. Choose the one that will best suit your purpose.
And don’t forget it’s a trial and error method. Have regular OKR check-ins and reviews. Collect feedback during and after each cycle. And use your learnings to avoid further mistakes in the next OKR cycle.
Pooja Pooja
Quarterly OKRs: 5 Tips for Successful Wrap-Up
Imagine a scene! the quarter is about to end and it’s time to review and wrap up quarterly OKRs.
The clock’s ticking. Everyone is in a rush. And you are busy evaluating which goals are yet to be achieved. And what has already been done. It’s also time to think about your priorities for the next quarter.
There are so many checklists and questions going in your head.
Have my teams found ways of closing out quarterly OKRs? Will my teams beat the clock and tick all the boxes? Have they reflected on their OKR progress? How will I deal with this end-of-quarter OKRs rush?
Feeling overwhelmed!!
Here is a step by step guide to help you prepare best to wrap up your quarterly OKRs–
Before you start to review and wrap up quarterly OKRs- remember that wrapping up quarterly OKRs is teamwork. And to see the best results every team irrespective of their department have to come together.
Track your team’s OKR progress and gather the key results scores. You can score your OKRs on a scale of 1 to 10 on the basis of how far the objectives have been achieved.
This will help you evaluate your progress in a truly data-driven manner.
If the scores are low this might suggest that your OKRs were unrealistic. On the other hand, if the score is too high it may suggest that your OKRs were not ambitious enough.
Whatever learning you made from this process. It will help you to form the basis for designing your next set of quarterly OKRs.
Make sure everyone is up to date
It is important to ensure that your teams have clarity about their OKR status. At the same time, they have visibility into what other teams have been doing. It can be achieved through regular check-ins with your teams. Check this ebook on OKR handbook.
This step will help you check if your teams are aligned or not. When everyone in your team is on the same page taking decisions based on priorities becomes easy. As you have the data in hand to rely on instead of guessing.
Organize OKR check-ins
The importance of check-ins for OKR success cannot be emphasized enough. OKR check-ins provide you an opportunity to have 1 on 1 discussion in all OKR matters.
With OKR check-ins you can discuss with your leaders and team members about – what went well, what didn’t work for them, what needs to be dealt with immediately, what problems they are facing etc. at an individual as well as team level.
OKR check-ins will help you understand what’s holding teams back. You will further get the chance to push priorities that might have shifted midway.
Dig into opportunities
Organize Quarterly OKRs review meetings to dig into opportunities. During these meetings, go through each key result with your teams. Find out what went well and what needs to be done better.
Let the OKR leaders from each team present their learnings and achievements before everyone. Here teams can give a small presentation highlighting the most important lessons with context.
So that other teams can benefit from their learnings and experiences. And use them in designing their OKRs for the next quarter.
If you are a large-scale company working with multiple departments. The OKR review meetings can be held at the departmental level.
Plan the future
Now that you have gathered the data and matrix you need through OKR check-ins and OKR review meetings. It’s high time to plan for the next quarter.
OKRs have the power to build the future of your organization. But OKR failures can cost you a fortune.
Hence it’s important to find out the core reasons behind your OKR success or failure for the present quarter. And use it as context while designing OKRs for the next quarter.
[elementor-template id=”89725″]
Do you need to plan new OKRs every quarter?
“Should OKRs change every quarter?” is a question often left unanswered.
Even after an OKR is achieved, you can roll it forward for the next quarter if necessary.
For example, if your OKR was to increase customer satisfaction by 20% in the present quarter. This could be relevant even for the next few quarters.
In case, of missed OKRs, you need to take a call. And decide whether you want to carry it forward or set new OKRs based on the data gathered.
When should you review and wrap up Quarterly OKRs
You should preferably wrap up the quarterly OKRs at least a week prior to the beginning of the next quarter.
But the preparation and discussions for the next quarter should be initiated almost a month before the new quarter begins. This is because designing OKRs takes dedication, time, and effort.
Bonus Tips:
Maintain Transparency from day one. Keep data transparent so that everyone knows how it’s going.
Create a culture of critical feedback. Be honest when it comes to feedback. At the same time be open to getting feedback from your teams as well.
Celebrate wins– even the smallest ones. Recognize your teams for their achievements more often.
Over-communicate. Communication is the key when it comes to wrapping up quarterly OKRs.
Take a moment
Wrapping up end-of-quarter OKRs will allow you to pause and take a moment to think. It provides you time to reflect on your wins, failures, and setbacks. It’s a stitch in time to make sure that your OKR framework is a success.
Follow the steps given to close out quarterly OKRs and make the most out of the process.