Many HR teams rely on generic or disconnected metrics that fail to inform real decisions. A lifecycle-aligned framework of actionable talent management metrics cuts through the clutter.
From sourcing to succession, it outlines what to track, why it matters, and how to operationalize insights for measurable business impact.
You’re Not Just Losing Talent – You’re Losing Millions.
Most companies don’t realize the hidden costs of poor talent decisions until it’s too late. Each bad hire can drain up to $15,000 from your bottom line. Meanwhile, organizations that invest in data-driven talent management see 56% higher engagement and 40% lower turnover not by luck, but by measurement.
The real competitive edge in 2025 isn’t better perks, it’s better decisions.
This guide breaks down the metrics that matter most across every stage of the talent lifecycle from attracting the right people to retaining top performers. You’ll learn how to move from reactive firefighting to predictive advantage using KPIs that drive clarity for managers and real outcomes for employees.
“Predictive metrics and advanced analytics help you move from reacting to problems to preventing them…”
Not Sure Which Talent Metrics to Focus On? Here’s Where to Start
Below are the specific metrics we’ll explore categorized by each critical stage of the employee lifecycle so you can track, benchmark, and improve with precision:
Metric 1: Attraction and Sourcing
Metric 2: Hiring and Selection
Metric 3: Onboarding and Integration
Metric 4: Development and Performance
Metric 5: Engagement and Retention
Metric 6: Succession and Talent Pipeline
Understanding and Building Your Talent Metrics Framework
Talent management metrics are quantifiable measures that track the flow of talent through your organization from initial attraction through development and eventual transition. These measurements provide objective insights into your talent strategy’s effectiveness and identify optimization opportunities.
Key Distinctions:
Metrics: Raw data points (time-to-hire, turnover rate)
KPIs: Strategic metrics aligned with business goals (quality of hire, employee engagement)
Analytics: Insights derived from combining multiple metrics for decision-making
Leading vs. Lagging Indicators:
Leading indicators predict future outcomes (candidate pipeline strength, early engagement scores)
Lagging indicators measure past results (annual turnover, final performance ratings)
To be effective, your metrics need to do more than track they need to drive business outcomes. Organizations that align talent metrics with strategic goals see 2.3x higher revenue growth than those that don’t.
“When talent metrics align with business strategy, HR shifts from support function to strategic engine.”
– Laszlo Bock ,Former SVP People Operations, Google
Framework Essentials:
Business Alignment: Link each metric to specific organizational goals
Balanced Scorecards: Combine efficiency, effectiveness, and impact measures
Benchmark Setting: Establish internal baselines and external comparisons
Reporting Cadence: Match reporting frequency to decision-making needs
Strategic Framework: Connecting Metrics Across the Talent Lifecycle
To be effective, talent metrics must align with the full employee lifecycle. Here’s how:
1.Attraction: Are we attracting the right candidates? 2.Recruitment: How efficient is our hiring process? 3.Onboarding: Are new hires ramping up successfully? 4.Performance: Are people meeting goals and expectations? 5.Development: Are we enabling career growth? 6.Retention: Are we keeping our best people? 7.Offboarding: Are we learning from attrition?
Talent Acquisition Metrics: From Attraction to Onboarding
These metrics help you attract top talent, streamline hiring, and ensure new employees hit the ground running with clarity and confidence.
Stage 1: Attraction and Sourcing Metrics
Sourcing Effectiveness Metrics:
Candidate Pipeline Strength measures qualified candidates per open role, providing managers with visibility into recruitment capacity and helping employees understand competition levels for internal opportunities.
Target: 3-5 qualified candidates per role
Calculation: Qualified candidates ÷ open positions
Source Quality Ratio tracks conversion rates by recruitment channel, enabling managers to allocate resources effectively while ensuring employees see diverse, high-quality colleagues joining the team.
Calculation: (Hires from source ÷ applications from source) × 100
Time-to-Source measures days to build qualified candidate pools, giving managers realistic timeline expectations and helping employees understand recruitment thoroughness.
Target: 14-21 days for standard roles
Calculation: Days from job posting to qualified candidate pool completion
Employer Brand Metrics:
Career Page Engagement tracks website interaction quality, providing managers insights into attraction effectiveness while showing employees how compelling their workplace appears to prospects.
Key indicators: Page views, time on site, application start rate
Target: 60%+ application start rate from page visitors
Employee Net Promoter Score (eNPS) for Employer Brandmeasures workforce advocacy, giving managers confidence in their team’s satisfaction while empowering employees as brand ambassadors.
Target: 50+ eNPS score
Calculation: % Promoters – % Detractors
Stage 2: Hiring and Selection Metrics
Time-Based Metrics:
Time-to-Hire tracks days from application to offer acceptance, providing managers with realistic planning timelines while setting appropriate expectations for candidates and internal stakeholders.
Target: 30-45 days for professional roles
Manager Outcome: Predictable hiring schedules for team planning
Offer Acceptance Rate measures percentage of offers accepted, giving managers confidence in their value proposition while ensuring competitive positioning for employees.
Cost-per-Hire calculates total recruitment investment per successful hire, enabling managers to budget effectively while ensuring quality investment in team building.
Target: $4,000-$7,000 per professional hire
Calculation: Total recruitment costs ÷ number of hires
Quality of Hire Metrics
New Hire Performance Ratings at 90/180/365 days provide managers with objective success measurement while giving new employees clear performance benchmarks.
Target: 80% of new hires meet/exceed expectations at 90 days
Manager Outcome: Validation of hiring decisions and early intervention opportunities
Employee Outcome: Clear performance expectations and development feedback
Quality of Hire Index combines multiple performance indicators into a composite score, offering managers comprehensive new hire assessment while providing employees with holistic success criteria.
Time-to-Productivity measures days for new hires to reach full performance standards, giving managers realistic expectations while providing employees with clear success timelines.
Target: 60-90 days depending on role complexity
Manager Outcome: Resource planning and support allocation
Employee Outcome: Achievable milestones and progress visibility
New Hire Satisfaction Scores at 30/60/90 days track integration success, enabling managers to identify improvement opportunities while ensuring positive employee experiences.
Target: 4.2+ on 5-point scale
Collection method: Pulse surveys with specific onboarding questions
Onboarding Completion Rate tracks program adherence, providing managers with process compliance visibility while ensuring employees receive comprehensive preparation.
Target: 95%+ completion rate
Manager Outcome: Consistent team member preparation
Calculation: (90-day departures ÷ new hires) × 100
Stage 4: Development and Performance Metrics
Learning and Development KPIs
Training Participation Rate measures engagement with development opportunities, providing managers insights into team growth motivation while offering employees visibility into learning culture strength.
Target: 80%+ participation in relevant programs
Manager Outcome: Team development engagement levels
Employee Outcome: Cultural commitment to growth
Internal Promotion Rate tracks career advancement opportunities, giving managers succession planning confidence while demonstrating career potential to employees.
Target: 70% of leadership roles filled internally
Calculation: (Internal promotions ÷ total promotions) × 100
Skills Gap Closure Rate measures development program effectiveness, enabling managers to assess team capability building while showing employees tangible growth progress.
Target: 75% of identified skill gaps closed within 12 months
Manager Outcome: Strategic capability planning
Employee Outcome: Clear skill development pathways
Performance Management Metrics
Goal Achievement Rate tracks objective completion across teams, providing managers with performance visibility while giving employees clear success measurement.
Target: 85% of goals achieved or exceeded
Manager Outcome: Team productivity and alignment assessment
Employee Outcome: Objective success criteria and recognition
Manager Effectiveness Scores from direct reports measure leadership quality, giving managers feedback for improvement while ensuring employees have quality leadership support.
Target: 4.0+ on 5-point scale
Collection method: 360-degree feedback surveys
“If you don’t measure your employee experience, you’ll end up managing based on guesswork.”
Employee Outcome: Validation that feedback drives change
Pulse Survey Participation Rate tracks feedback engagement, giving managers visibility into communication effectiveness while demonstrating to employees that their opinions matter.
Target: 75%+ participation rate
Manager Outcome: Team communication health
Employee Outcome: Evidence of voice and influence
Retention Analysis Metrics
Voluntary Turnover Rate measures employee-initiated departures, providing managers with retention effectiveness data while indicating workplace satisfaction to employees.
Target: <10% annual voluntary turnover
Calculation: (Voluntary departures ÷ average headcount) × 100
Regrettable Turnover Rate identifies high-performer departures, alerting managers to retention risks while highlighting the value placed on top talent.
Target: <3% regrettable turnover annually
Manager Outcome: Critical talent retention focus
Employee Outcome: Recognition of individual value
Cost of Turnover quantifies departure impact, enabling managers to justify retention investments while demonstrating organizational commitment to employee stability.
Target: <15% of annual salary per departure
Components: Replacement costs + lost productivity + training investment
Stage 6: Succession and Talent Pipeline Metrics
Succession Planning KPIs
Succession Bench Strength measures leadership pipeline depth, providing managers with development planning insights while showing employees advancement opportunities.
Target: 2+ qualified successors per critical role
Categories: Ready now (0-1 year), ready soon (1-3 years), ready later (3+ years)
Internal Fill Rate for Leadership Positions tracks promotion effectiveness, giving managers confidence in development programs while demonstrating career potential to employees.
Target: 75%+ of leadership roles filled internally
Manager Outcome: Succession planning validation
Employee Outcome: Visible advancement pathways
Talent Mobility Metrics
Internal Mobility Rate measures cross-functional movement, providing managers with talent utilization insights while offering employees career diversification opportunities.
Target: 20%+ of employees move roles annually
Manager Outcome: Talent retention through growth
Employee Outcome: Career flexibility and development
Using Predictive Analytics to Stay One Step Ahead of Talent Challenges
As your talent strategy evolves, relying solely on historical data isn’t enough. Predictive metrics and advanced analytics help you move from reacting to problems to preventing them, making your workforce strategy smarter, faster, and future-ready.
Turnover Prediction Accuracy uses data modeling to forecast departures, enabling managers to proactively address retention risks while providing employees with improved workplace conditions.
Employee Outcome: Addressed concerns before departure consideration
Performance Prediction Models forecast future success based on early indicators, helping managers make informed development investments while giving employees clear improvement pathways.
Target: 75%+ prediction accuracy for high performers
Applications: Promotion readiness, development focus areas
How to Operationalize Talent Metrics: Tools and First Steps
Understanding metrics is only half the battle, implementing them effectively is where the real impact happens. This section outlines the essential tools to support your measurement efforts and a practical roadmap to help you get started.
Essential Tools to Power Your Talent Metrics
HRIS Integration: Centralized data collection and automated reporting reduce manual work for managers while ensuring consistent employee experience tracking.
Survey Platforms: Regular feedback collection gives managers ongoing insights and ensures employees have a consistent voice in shaping improvements.
Where to Start: Build a Metrics-Driven Culture
Creating a sustainable talent metrics strategy requires starting with high-leverage areas and scaling thoughtfully. Focus on feasibility, business relevance, and long-term scalability.
Priority Framework
High Impact, Low Complexity: Start with basic retention and engagement metrics
Business-Critical Areas: Focus on metrics tied to current organizational goals
Data Quality: Ensure accurate and consistent data collection before expanding scope
Implementation Steps
Baseline Establishment: Measure your current state across key metrics
Target Setting: Define realistic improvement goals with timelines
Reporting Rhythm: Set up monthly reporting with quarterly deep dives
Action Planning: Translate insights into specific, accountable interventions
Where Most Teams Go Wrong and How to Get Talent Metrics Right
Even the best metrics won’t drive results if they’re misused. Here are the most common mistakes to avoid and the proven practices that ensure your talent measurement efforts lead to real impact.
Measurement Mistakes to Avoid
Metric Overload: Tracking too many KPIs dilutes focus and confuses priorities for both managers and employees.
Solution: Limit to 15-20 core metrics across all lifecycle stages
Solution: Use statistical analysis and consider external factors
Context Ignorance: Failing to account for business cycles, market conditions, or organizational changes skews interpretation.
Solution: Include qualitative context with quantitative data
Success Factors for Implementation
Executive Sponsorship: Leadership support ensures resource allocation and accountability for managers while demonstrating organizational commitment to employees.
Clear Definitions: Standardized calculations prevent confusion for managers and ensure fair evaluation for employees.
Regular Communication: Consistent sharing of results and insights keeps managers informed while showing employees that measurement drives improvement.
Action-Oriented Approach: Using metrics to drive specific changes provides managers with clear direction while delivering tangible workplace improvements for employees.
Proving the ROI of Talent Metrics and What’s Coming Next
HR leaders are under pressure to show results, not just reports. This section shows how effective talent metrics directly impact business performance and how to stay ahead with future-ready measurement strategies.
Demonstrating Value Through Metrics
Organizations with comprehensive talent metrics see measurable business impact:
23% higher profitability through improved talent decisions
56% higher employee engagement via data-driven improvements
40% lower turnover costs through predictive retention strategies
Want to stay ahead of the curve? Keep an eye on these fast-emerging trends:
*AI-Enhanced Predictions Smarter models are forecasting attrition, performance, and promotion readiness with increasing accuracy.
*Real-Time Feedback Pulse surveys and continuous listening tools are replacing outdated annual reviews.
*Skills-Based Metrics Organizations are shifting from role-based tracking to competency-driven talent models.
Your Step-by-Step Plan to Put Talent Metrics Into Action
Turning insights into impact starts with a clear roadmap. Here’s how to roll out your talent metrics strategy in phases so it’s realistic, scalable, and results-driven from day one.
Month 1-2: Foundation
Audit current measurement capabilities
Select initial 10-12 core metrics
Establish baseline measurements
Train key stakeholders on interpretation
Month 3-6: Core Implementation
Deploy measurement systems across all lifecycle stages
Begin monthly reporting rhythm
Identify initial improvement opportunities
Start action planning based on insights
Month 7-12: Advanced Analytics
Add predictive modeling capabilities
Implement benchmarking against industry standards
Expand to comprehensive dashboard reporting
Demonstrate ROI and business impact
Ongoing: Optimization
Regular metric review and refinement
Continuous improvement based on feedback
Scaling successful practices organization-wide
Preparing for next-generation measurement approaches
Start Measuring What Matters With Peoplebox.ai
Don’t wait to see the benefits start small, act fast, and build momentum.
The most successful organizations don’t guess their way through talent decisions. They measure, analyze, and optimize continuously with tools that drive action, not just reports.
Here’s your quick-start checklist:
✅ Select 5–7 metrics aligned with your biggest talent priorities
✅ Establish baselines and set measurable improvement goals
✅ Build a monthly reporting rhythm tied to action plans
✅ Involve your managers because metrics only matter when they inform decisions
That’s wherePeoplebox.ai helps you scale with confidence.
Peoplebox.ai is an all-in-one talent management platform built for fast-moving HR and business teams. It enables you to:
Automatically track key metrics across the entire employee lifecycle
Align talent KPIs with business goals through integrated OKRs
Identify red flags early with predictive insights and attrition risk signals
Empower managers with real-time dashboards and next-step action plans
Whether you’re just getting started or scaling people operations across the org, Peoplebox.ai turns talent metrics into business outcomes fast.
Book a demo and start measuring what truly matters today.
Frequently Asked Questions(FAQs)
Talent management metrics are data points that track how effectively an organization attracts, develops, and retains talent. They help HR leaders make informed decisions tied to business outcomes.
Key performance-related metrics include goal achievement rate, manager effectiveness scores, high performer ratio, and skills gap closure rate.
Success can be measured using time-to-productivity, new hire satisfaction scores, onboarding completion rate, and 90-day turnover rate.
Organizations that use the right KPIs see up to 56% higher employee engagement and 40% lower turnover. The typical ROI can range from 300–500% within 18 months.
Predictive analytics help HR leaders forecast turnover, identify promotion readiness, and intervene early turning HR from reactive to strategic.
Key tools include HRIS systems, analytics dashboards, and survey platforms to automate data collection, reporting, and feedback.
Leading indicators predict future outcomes (e.g., engagement score), while lagging indicators reflect past results (e.g., turnover rate).
What stood out is the deep understanding of the Peoplebox.ai team and their willingness to listen & enhance the platform to scale with our long-term needs.
Khilan Haria
VP and Head of Payments Product, Razorpay
I'm glad that we partnered with Peoplebox.ai for our company-wide OKR rollout. Thanks to its simplicity, we achieved significant adoption within two quarters
Rohit Arumugam
Business Head, Nova Benefits
Since we started using Peoplebox.ai, we have been able to bring all of our leadership across the organization together and show them how all of our goals align
Jaclyn Hoover
Senior Director HR, Propel School
Driving the entire interface through slack is simply brilliant especially for a tech product company! There was zero time spent on training! It can not get easier than that!
Swapna Nair
VP - HR, Khatabook
I chose Peoplebox.ai because it had integrations with the tools we use for sales and engineering to automate updating of key results and sync projects
How to Roll Out OKRs for First Time: 7 Steps Startegy
How to Roll out OKRs for the first time is a question common among organizations just introducing OKRs.
Imagine a scenario-
You are rolling out OKR for the first time.
One thing goes wrong and… Boom!
Your employees are already hating the process- even before it took a pace.
You certainly wouldn’t want that to happen in your organization. OKRs can surcharge and accelerate your organizational growth. But the key is to get this done right.
That’s why a well-planned rollout is significant for the success of an OKR system.
Introduce the new goal-setting approach strategically but not in a mechanical process. Every organization is unique and can face unique challenges while implementing OKRs.
[elementor-template id=”89725″]
How to roll out OKRs: Here are 7 Best Practices for a successful OKR rollout
1 Communicate the OKR Methodology to all the teams
Get everyone in the organization on board with OKRs. Present the concept clearly and precisely. Educate everyone on the OKR language.
While some people will embrace the changes with open arms, there are also going to be some skeptics into the bargain. You must let them express their concerns and provide answers to their “why, how, and what?” questions.
Explain to them the benefits of implementing the OKR framework. Highlight how it’s going to impact the business and the individual success of the employees.
Organize workshops, training, discussions, introductory presentations, and seminars to help your employees’ design quality OKRs. Transparently explain to them the strategic execution, alignment, expectations, and tools they will be required to use for the purpose.
To help everyone speak the same language, document your company OKR framework
2 Inspire with success stories
List the names of reputed companies like Google, Netflix, Intel, LinkedIn, Twitter, etc. which have successfully implemented OKRs. Narrate their success stories to help them visualize how OKRs can cater to their individual success.
For example, OKRs helped LinkedIn become a 20 Billion Company. Jeff Weiner, CEO of LinkedIn, describes OKRs as, “something you want to accomplish over a specific period of time that leans toward a stretch goal rather than a stated plan.
It’s something where you want to create greater urgency, greater mindshare.”
You can either go for an organization-wide rollout Consider running an OKR Pilot first, depending on what fits you best.
If you have a culture that’s open to change and a flexible structure of functioning, an organization-wide rollout will work best for you. But it’s always best to take small steps. Start from one part and gradually move to others.
[elementor-template id=”89725″]
Crafting and implementing OKRs across the entire organization can seem overwhelming especially if you are a large organization. Instead, choose a particular part of the organization and run a pilot project.
“If you concentrate on small, manageable steps you can cross unimaginable distances.”
It’s also important to decide “how often?” will OKRs be reviewed. Will it be done quarterly or annually?
4 Go for the Top-down approach
A top-down approach to OKRs was the first pattern attempted. The top management has a significant role in setting the overall direction of the company. Starting from the top provides clarity for the rest of the organization.
“People buy into the leader before they buy into the vision.”
For example, you can start with the senior leadership team. Make them an example to roll out OKRs to the departmental heads. From there you can move on to team leaders, and to the rest of your teams.
5 Get aligned
You can’t just sit with a blank sheet in front and magically start crafting the perfect OKRs. You need to understand the context. Make the company mission and vision your starting point and tailor your OKRs accordingly.
Buy-ins are critical for OKR success. The success of OKRs depends on the collective effort of each team member. You can imagine it as a group dance performance where everyone needs to perform their parts well to make it a masterpiece.
Thus you need to align the efforts of the workforce, executive leaders, and company heads both horizontally and vertically. This will help you foster transparency, smooth cross-functional communication, and reduce overlap among departments.
6 Track and monitor progress
Tracking OKRs are important to evaluate and measure the progress and understand which teams are falling short.
You can identify any issues and make course corrections as required by Monitoring progress.
Leverage technology to track OKRs. It will make the process transparent.
Using OKR software will also automate the calculations and save your time as you are no longer required to manually update the progress of each team member.
Bonus tip: Remember to celebrate whenever you Hit the nail on the head through OKR win meetings and shoutouts to keep
7 Do frequent check-ins
To stay on top of OKR progress, you need to do regular check-ins. Employees might feel overwhelmed with concerns and doubts, especially in the initial days.
Regular check-ins will give your employees direction. And provide them the required assistance and guidance. Frequent Check-in meetings will also identify the overlappings, increase accountability and ensure execution.
Define your preferred frequency of Check-in meetings. You can do it weekly or monthly as per your organization’s needs. Although weekly check-ins are most recommended to keep track of the progress and evaluate continuously.
Have OKR Champions
Consider having OKR champion who starts implementing the OKR framework with a strong war cry. Build a team of champions who will work as ambassadors to head the change. And make the OKR framework run smoothing across the organization.
They work as mentors and internal OKR experts. And can help you adopt and execute OKRs at all levels of the organization. These OKR enthusiasts will make sure that every concern is addressed, every ‘whys and wherefores’ are explained.
Too many objectives and key results: Less is more. Don’t set more than 5-7 Objectives and 3-5 key results.
Fill it, Forget it: Don’t set OKRs just to forget in a few days.
Mixing KPIs with OKRs: KPIs aren’t a substitution for OKRs. They have separate roles and outcomes.
Rigidity: Rigid adherence to rules can lead to disengagement. Instead, move forward with a flexible and intuitive OKR approach
Link OKRs with Recognition: Don’t make the mistake of making OKRs a base for your reward and recognition program. It can negatively affect performance. And compromises the business output.
The start is never perfect
You might struggle when you are just starting. But after a few OKR cycles, you are sure to hit your stride.
To end, OKR’s success depends on consistency. So, remember to continuously reflect, learn, and refine the process.
Hope we were able to answer all your queries in our blog How to roll out OKRs for the first time? If you have questions feel free to comment below.
Pooja Pooja
Types of OKRs: Aspirational OKRs vs Committed OKRs
Every organization wants to grow, but how do you set goals that are both achievable and visionary? The answer lies in the types of OKRs: committed and aspirational.
Whether it’s near-term performance or long-term innovation for your business, you’ll know just how to leverage the power of committed and aspirational OKRs effectively to unlock new levels of success for your business.
Committed OKRs are about clear, attainable targets that teams can confidently deliver within a set timeframe. This type of OKR delivers accountability and is important for day-to-day business success.
Aspirational OKRs, on the other hand; push teams to be bigger and challenge themselves. The moonshots: ambitious OKRs are meant to stretch an organization from its comfort zone, kindling innovation and long-term growth.
In the rest of this blog, we will take the difference between these two types of OKR apart and see how to balance them in such a way that they enable performance as well as inspiration.
What are Aspirational OKRs and Other Types of OKRs?
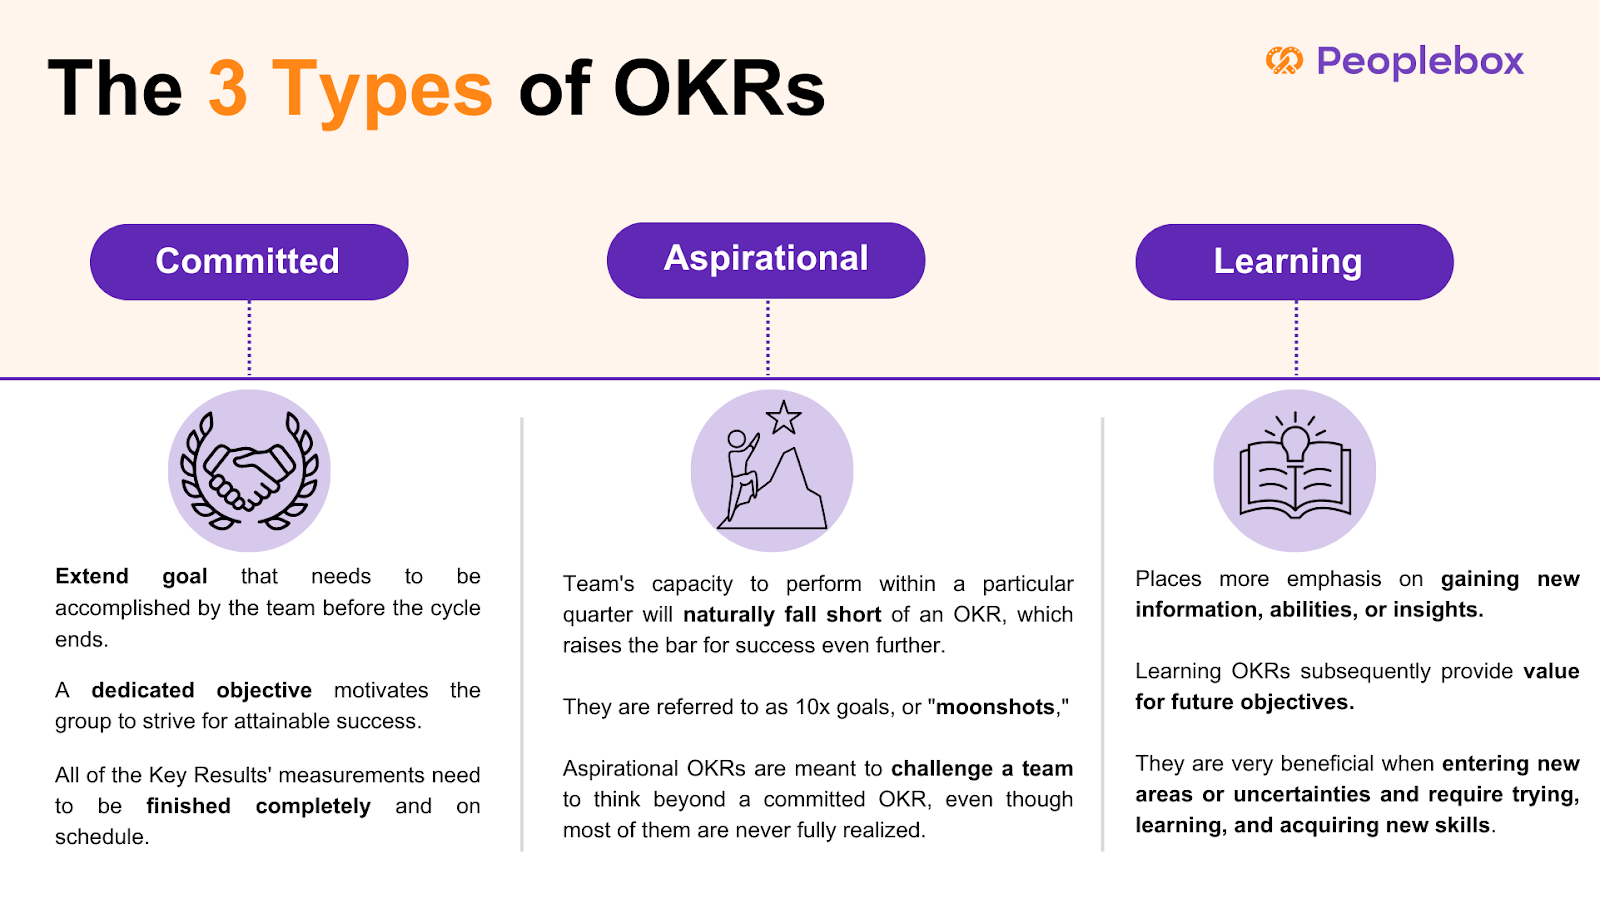
A committed OKR is a stretch goal that the team has to achieve or complete before the cycle is over. A committed goal pushes the team to reach, but still achievable attainment. All metrics of the Key Results must be completed fully and on time. Consider a situation like this:
Daniel’s organization and his teams have agreed to execute certain OKRs and have mapped a precise action plan on how they are going to do so.
These are called Committed OKRs.
An aspirational OKR sets the bar for success further out, and by design will exceed a team’s ability to execute in a given quarter. When they set such a high bar as to be seemingly impossible they are called 10x goals, or “moonshots.” While most aspirational OKRs are never fully achieved, they exist to push a team to think bigger than a committed OKR. Consider the following case:
Martha’s organization is more visionary. They have stretched goals. And her teams are not likely to fully achieve these ambitious goals.
These are called Aspirational OKRs.
Understanding the distinction between aspirational and committed goals is crucial for effective goal-setting and team motivation within the OKR framework. Aspirational goals encourage ambitious thinking and long-term vision, while committed goals focus on immediate, measurable outcomes.
Learning OKR focuses on the acquisition of knowledge, new skills, or insights rather than a direct achievement of business outputs. Extremely helpful when entering new areas or uncertainties and requires experimenting, learning, and developing new skills, Learning OKRs distinguish between usual output measuring of success and measuring acquisition of knowledge, that will later add value for future objectives. For example:
Jerry wants to gain a deep understanding of machine learning to drive full product development. He wants to finish three advanced courses and test his skills by building a model in sandbox.
These are called Learning OKRs.
Aspirational OKRs and Committed OKRs: Key differences
When you aim for the stars, you may come up short, but still reach the moon.
– Larry Page
Read on to find out the key difference between Committed OKRs and Aspirational OKRs.
Objective
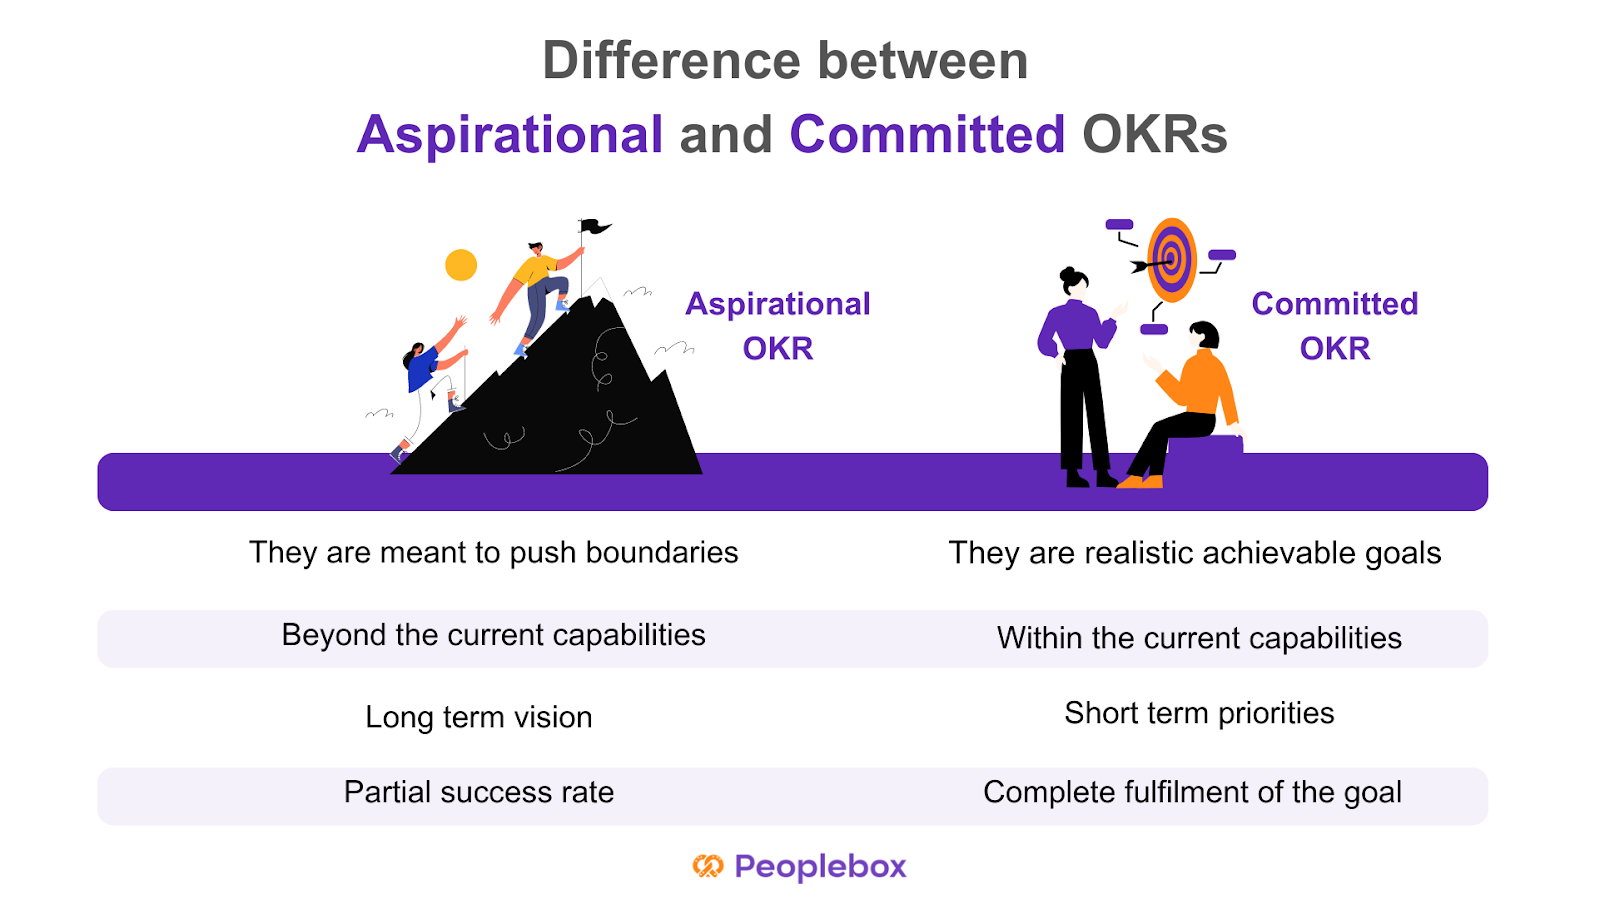
Aspirational OKRs are meant to push the boundaries and encourage employees to achieve visionary objectives. Committed OKRs, on the other hand, focus on committed objectives that offer a more realistic vision of goals with fully achievable results.
Aim
Committed OKRs help companies achieve their goals through individual and team achievements. Aspirational OKRs are often beyond the current capacities of the organization but help in pushing boundaries.
Timeframe
Aspirational OKRs are usually created to focus on long-term strategic vision while Committed OKRs offer short-term operational priorities to guarantee progress in the short term.
Committed OKRs are supposed to have a 100% success rate as each key result comprises fully achievable targets. Aspirational OKRs are usually found to have a success rate of 60-70%.
Committed and Aspirational OKR examples
The difference between committed and aspirational OKRs is subtle. Committed objectives are meant to be fully achievable, requiring teams to concentrate on straightforward priorities without taking unnecessary risks, ultimately serving as motivational tools to foster small wins and consistent progress.
A standard example in the sales team scenario might be like:
Committed OKR
O: Expand to the US market
KR1: Close first 6 start-ups
KR2: Get a meeting-to-close rate of 6%
KR3: Reach average deal size of $200
Aspirational OKR
O: Capture the entire US market in one quarter
KR1: Get onboard 95% of big customers in the US market to grow over competitors
KR2: Get a meeting-to-close rate of 30%
KR3: Reach average deal size of $2000
In the managerial team, these OKRs can manifest like such:
Committed OKR
O: Improve customer satisfaction with the existing solutions
KR1: Increase customer satisfaction score (CSAT) from 85% to 90% by the end of the quarter.
KR2: Reduce average response time from 15 minutes to 10 minutes within the next three months.
KR3: Train 100% of the support team on the new customer service tools within six weeks.
Aspirational OKR
O: Become the market leader in AI-powered customer service solutions.
KR1: Achieve a 30% market share in the AI customer service industry by the end of next year.
KR2: Launch three groundbreaking AI features that no competitor currently offers within 18 months.
KR3: Secure a partnership with at least two top-tier companies by the end of next year.
In a tech context, OKRs like these can come up:
Committed OKR
O: Improve the performance of the app and reliability
KR1: Reduce app crash rate from 2.5% to under 1% within the next quarter.
KR2: Decrease page load times by 30% in six months.
KR3: Fix 100% of the top ten reported bugs within the next two sprints.
Aspirational OKR
O: Revolutionize the user experience of our mobile app.
KR1: Increase daily active users (DAU) by 100% within 12 months.
KR2: Develop and launch a fully AI-driven recommendation system that personalizes the user experience by the end of the year.
KR3: Achieve a 4.8+ rating across app stores by introducing five innovative features within the next 18 months.
How to decide between Committed OKRs and Aspirational OKRs?
Committed OKRs will work best if your organization is newly introduced to the framework or is still in the rolling-out phase.
With each goal achieved, your team’s motivation and engagement will rise higher. In addition, teams easily get into the habit of running Committed OKRs and make it part of their work culture.
But if you have already used the framework in the past, aspirational OKRs can do wonders for you.
Creating a result-driven work culture takes time. It demands discipline, continuous effort, and a mindset shift of employees and management. So you should start simple and focus on learning the methodology first. And set up the necessary processes to make it work.
Setting aspirational OKRs in the very beginning would make your teams feel overwhelmed and over-pressurized. Extremely ambitious Key Results soon become too much to handle. Learning a new methodology takes time. Once your teams are used to the framework and it becomes a part of their work-life, you can consider aspirational OKRs.
With the later process, you can have objectives and a combination of committed and aspirational key results. While some key results will be easier to achieve, others will aim higher. Understanding the distinction between aspirational and committed goals is crucial for better goal-setting and team motivation.
Choosing the Right Type of OKRs
Choosing the right type of OKRs depends on the organization’s goals, culture, and priorities. Committed OKRs are suitable for organizations that need to achieve specific, measurable outcomes within a set timeframe. They are ideal for teams that require a clear direction and a sense of accountability. Aspirational OKRs, on the other hand, are suitable for organizations that want to drive innovation, creativity, and excellence. They are ideal for teams that want to push the boundaries and strive for something bigger.
When choosing between Committed and Aspirational OKRs, consider the following factors:
What are the organization’s goals and priorities?
What type of culture do we want to foster?
What kind of outcomes do we want to achieve?
What level of risk are we willing to take?
By considering these factors, organizations can choose the right type of OKRs that align with their goals, culture, and priorities. Whether you opt for committed or aspirational OKRs, the key is to ensure that they are aligned with your company aims and internal communication processes, fostering a balanced approach to achieving both immediate and long-term objectives.
How to balance Committed and Aspirational OKRs?
There is no one-size-fits-all answer, but where OKRs are aligned with company strategy, teams are well educated, open communication exists, and performance is reviewed regularly, it will help keep the balance between aspirational and committed OKRs intact.
However, the first step in finding equilibrium between the two forms of OKRs is that there has to be a knowledge of the difference. It needs to be apparent from the outset that everyone involved makes it clear the distinction between the two OKRs.
Teams and employees may have suitable insights that will assist in determining what is realistically achievable (committed) and what is a stretch but possible (aspirational). This can help determine what the balance ratio for the OKRs is going to be.
A very critical element to succeed with OKRs is reviewing and tracking the progress. With weekly check-ins, teams can go through their OKRs regularly and update the same performance data. It becomes easy to track how they have progressed on the outcome of the OKR in the OKR review process.
The grading of OKRs is very clear on the distinction between committed and aspirational goals. Committed OKRs are things to be accomplished within the cycle, and grading is binary: pass or fail. That is, an OKR is said to be successful if 100% of it is accomplished; otherwise, it is regarded as a failure. Aspirational OKRs, on the other hand, are graded along a more nuanced scale.
Common mistakes to avoid while setting up Aspirational OKRs
Here are 6 common mistakes organizations commit while setting up aspirational OKRs-
1️⃣Ignoring organizational structure and needs
A common mistake most organizations commit while writing aspirational OKRs is to write something like, “What can be done more if we have extra resources and luck favors us ?” Instead, you can pretend to be a genie and strive to understand “What our customer needs at present moment?”
2️⃣Unrealistic aspirational OKRs
Aspirational OKRs don’t imply setting unrealistic goals. It should be achievable, with the understanding that your teams won’t have any clue about how to achieve these OKRs. Aspirational OKRs demand overuse of resources. They are fluid and flexible. But still helps your teams focus on well-defined goals.
3️⃣Writing a low-value objective (LVO)
Moving forward with a “Who cares?” attitude is a common pitfall among organizations. Low-value objectives go unnoticed even after the successful completion of the key results.
4️⃣OKRs should be framed to gain tangible benefit
OKRs are a tool for organizations to work for big goals in the long run by breaking them into small chunks that can be achieved within a shorter cycle.
5️⃣A committed OKR must deliver a 1.0
It makes the framework stiff and doesn’t leave scope for improvement.
6️⃣Too many OKRs
How many aspirational OKRs you should set for one cycle will depend on your company’s resources. But never aim for too many Objectives and key results. As it can easily divert your focus altogether.
Best Practices for Implementing OKRs
Implementing OKRs requires a structured approach to ensure success. Here are some best practices to consider:
Align OKRs with company goals: Ensure that OKRs align with the organization’s overall goals and priorities.
Make OKRs specific and measurable: Ensure that OKRs are specific, measurable, achievable, relevant, and time-bound (SMART).
Set ambitious yet achievable goals: Set goals that are challenging yet achievable, and provide a clear direction for the team.
Establish clear key results: Establish clear key results that indicate progress towards achieving the objective.
Track progress regularly: Track progress regularly and provide feedback to teams and individuals.
Foster a culture of transparency and accountability: Foster a culture of transparency and accountability, where teams and individuals are held accountable for their progress.
Provide training and support: Provide training and support to teams and individuals to ensure they understand the OKR framework and how to use it effectively.
Review and adjust OKRs regularly: Review and adjust OKRs regularly to ensure they remain relevant and aligned with the organization’s goals.
By following these best practices, organizations can implement OKRs effectively and achieve their goals. Regularly reviewing and adjusting OKRs ensures that they stay aligned with the evolving needs of the organization, helping teams to maintain focus and drive continuous improvement.
Conclusion
Now that you know the difference between committed and aspirational OKRs and how they can impact your organization’s success, it’s the decision time. Choose the one that will best suit your purpose.
And don’t forget it’s a trial and error method. Have regular OKR check-ins and reviews. Collect feedback during and after each cycle. And use your learnings to avoid further mistakes in the next OKR cycle.
Pooja Pooja
Quarterly OKRs: 5 Tips for Successful Wrap-Up
Imagine a scene! the quarter is about to end and it’s time to review and wrap up quarterly OKRs.
The clock’s ticking. Everyone is in a rush. And you are busy evaluating which goals are yet to be achieved. And what has already been done. It’s also time to think about your priorities for the next quarter.
There are so many checklists and questions going in your head.
Have my teams found ways of closing out quarterly OKRs? Will my teams beat the clock and tick all the boxes? Have they reflected on their OKR progress? How will I deal with this end-of-quarter OKRs rush?
Feeling overwhelmed!!
Here is a step by step guide to help you prepare best to wrap up your quarterly OKRs–
Before you start to review and wrap up quarterly OKRs- remember that wrapping up quarterly OKRs is teamwork. And to see the best results every team irrespective of their department have to come together.
Track your team’s OKR progress and gather the key results scores. You can score your OKRs on a scale of 1 to 10 on the basis of how far the objectives have been achieved.
This will help you evaluate your progress in a truly data-driven manner.
If the scores are low this might suggest that your OKRs were unrealistic. On the other hand, if the score is too high it may suggest that your OKRs were not ambitious enough.
Whatever learning you made from this process. It will help you to form the basis for designing your next set of quarterly OKRs.
Make sure everyone is up to date
It is important to ensure that your teams have clarity about their OKR status. At the same time, they have visibility into what other teams have been doing. It can be achieved through regular check-ins with your teams. Check this ebook on OKR handbook.
This step will help you check if your teams are aligned or not. When everyone in your team is on the same page taking decisions based on priorities becomes easy. As you have the data in hand to rely on instead of guessing.
Organize OKR check-ins
The importance of check-ins for OKR success cannot be emphasized enough. OKR check-ins provide you an opportunity to have 1 on 1 discussion in all OKR matters.
With OKR check-ins you can discuss with your leaders and team members about – what went well, what didn’t work for them, what needs to be dealt with immediately, what problems they are facing etc. at an individual as well as team level.
OKR check-ins will help you understand what’s holding teams back. You will further get the chance to push priorities that might have shifted midway.
Dig into opportunities
Organize Quarterly OKRs review meetings to dig into opportunities. During these meetings, go through each key result with your teams. Find out what went well and what needs to be done better.
Let the OKR leaders from each team present their learnings and achievements before everyone. Here teams can give a small presentation highlighting the most important lessons with context.
So that other teams can benefit from their learnings and experiences. And use them in designing their OKRs for the next quarter.
If you are a large-scale company working with multiple departments. The OKR review meetings can be held at the departmental level.
Plan the future
Now that you have gathered the data and matrix you need through OKR check-ins and OKR review meetings. It’s high time to plan for the next quarter.
OKRs have the power to build the future of your organization. But OKR failures can cost you a fortune.
Hence it’s important to find out the core reasons behind your OKR success or failure for the present quarter. And use it as context while designing OKRs for the next quarter.
[elementor-template id=”89725″]
Do you need to plan new OKRs every quarter?
“Should OKRs change every quarter?” is a question often left unanswered.
Even after an OKR is achieved, you can roll it forward for the next quarter if necessary.
For example, if your OKR was to increase customer satisfaction by 20% in the present quarter. This could be relevant even for the next few quarters.
In case, of missed OKRs, you need to take a call. And decide whether you want to carry it forward or set new OKRs based on the data gathered.
When should you review and wrap up Quarterly OKRs
You should preferably wrap up the quarterly OKRs at least a week prior to the beginning of the next quarter.
But the preparation and discussions for the next quarter should be initiated almost a month before the new quarter begins. This is because designing OKRs takes dedication, time, and effort.
Bonus Tips:
Maintain Transparency from day one. Keep data transparent so that everyone knows how it’s going.
Create a culture of critical feedback. Be honest when it comes to feedback. At the same time be open to getting feedback from your teams as well.
Celebrate wins– even the smallest ones. Recognize your teams for their achievements more often.
Over-communicate. Communication is the key when it comes to wrapping up quarterly OKRs.
Take a moment
Wrapping up end-of-quarter OKRs will allow you to pause and take a moment to think. It provides you time to reflect on your wins, failures, and setbacks. It’s a stitch in time to make sure that your OKR framework is a success.
Follow the steps given to close out quarterly OKRs and make the most out of the process.